Datasets
A curated collection of single-cell analyses. Open any dataset directly in Cytely to explore the methodology, imaging, and results.
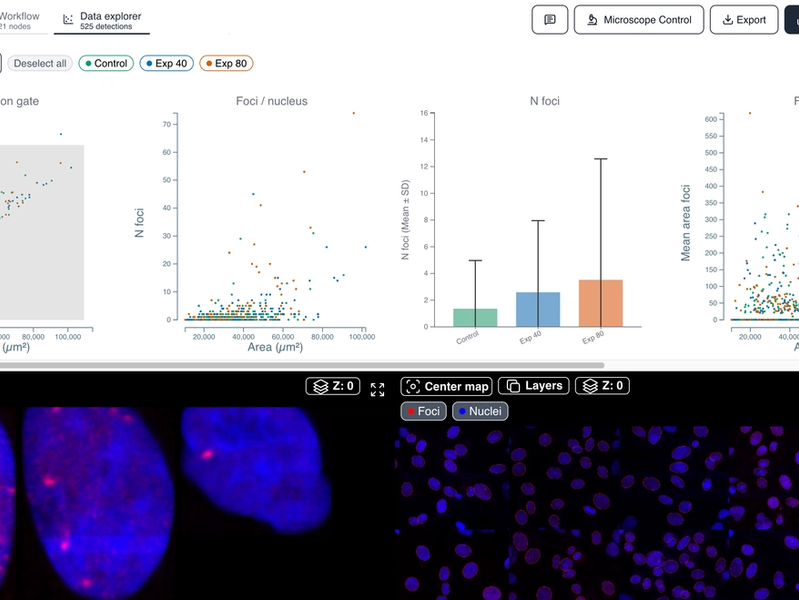
DNA Damage & Genotoxicity - Foci Counting per Nucleus
Cells exposed to two concentrations of a DNA-damaging agent and stained for nuclei and DNA damage foci. This example dataset shows how to count damage foci per nucleus, exclude aggregates by gating on nuclear shape, and compare mean foci counts between treatment groups. The foci count per nucleus rises with the concentration of the damaging agent.
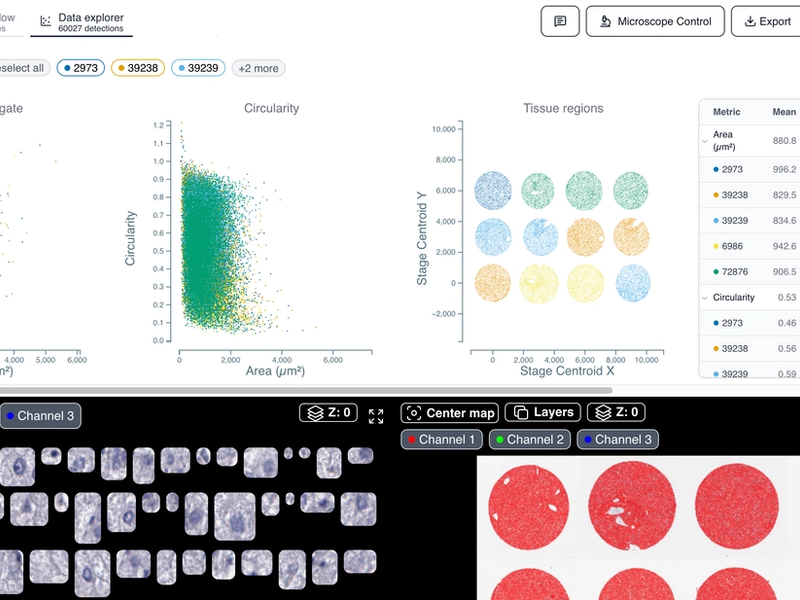
Tissue Cellularity Quantification - Nuclei Counting in Tissue Sections
Hematoxylin-stained human tissue sections from the Human Protein Atlas. This example dataset shows how to count nuclei and cells across whole tissue sections and report cellularity per region. Every detected object keeps its position in the section, so regions of interest can be gated directly on the tissue map and compared for area, perimeter, and circularity.
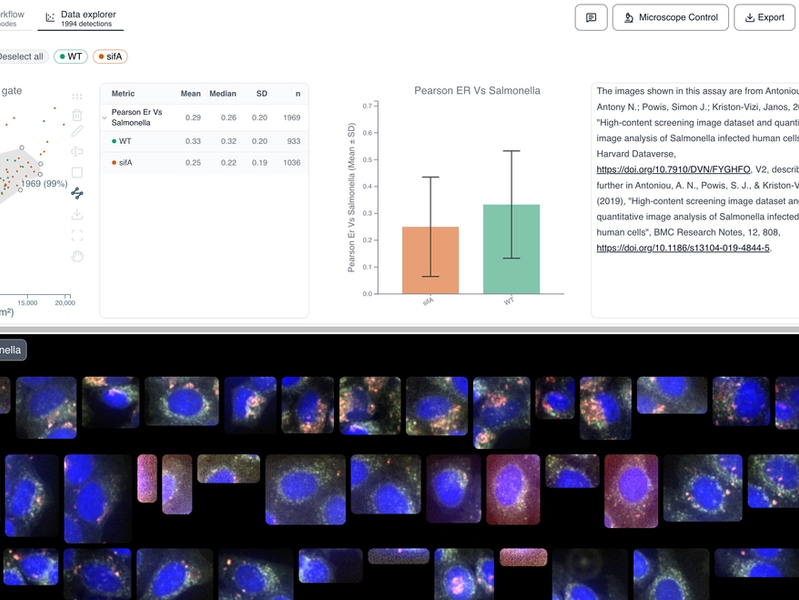
Protein Co-localization - Salmonella and ER Membrane
HeLa cells infected with mCherry-labelled Salmonella enterica and stained with an ER-tracker dye, imaged by high-content confocal microscopy. This example dataset shows how to quantify colocalization between intracellular bacteria and the host endoplasmic reticulum, comparing wild-type and isogenic ΔsifA mutant strains.
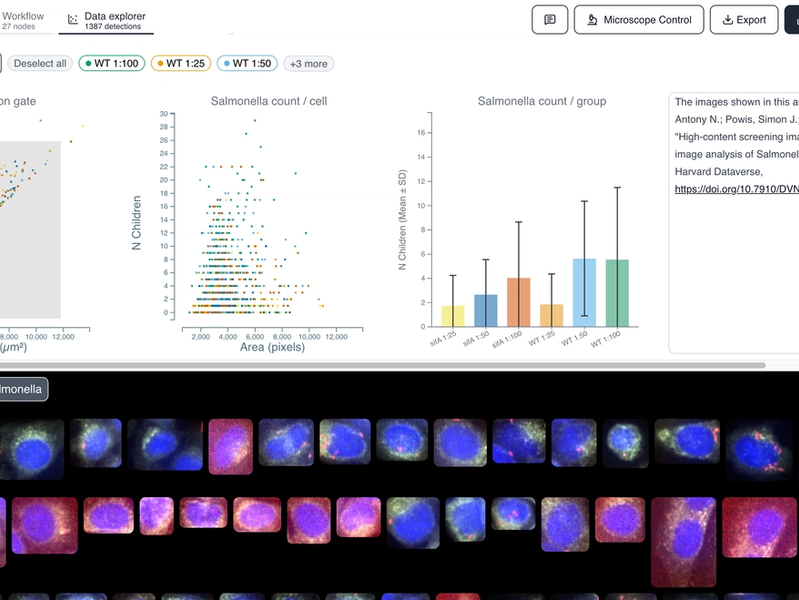
Bacteria Internalization - Salmonella Infected HeLa Cells
HeLa cells infected with mCherry-labelled Salmonella enterica, imaged by high-content confocal microscopy. This example dataset shows how to detect and quantify intracellular bacteria at the single-cell level, comparing the number of bacteria per host cell across different pathogen concentrations.
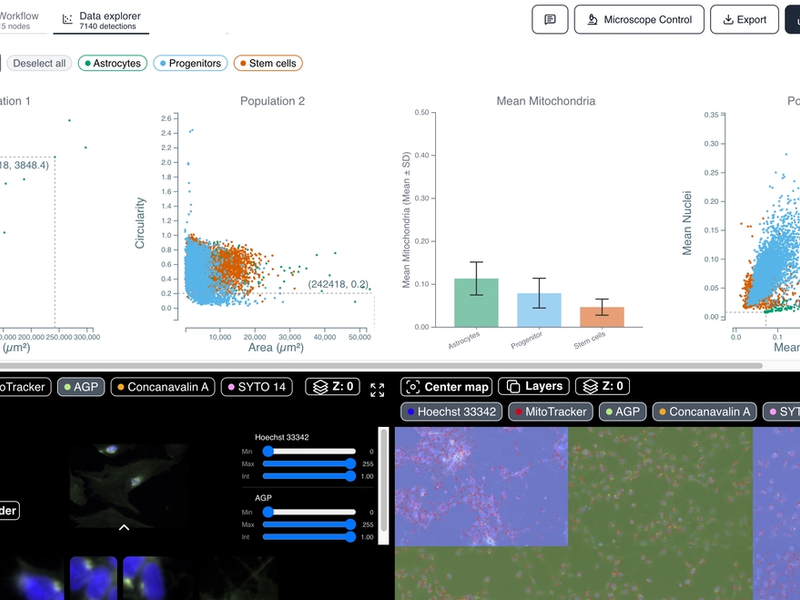
Cell Morphology - Pluripotent Stem Cell Differentiation States
A multi-channel high-content image dataset of human pluripotent stem cells. This example dataset shows how to explore and distinguish cell subpopulations by morphology with Cytely: segmenting nuclei and cytoplasm, measuring morphological features and signal intensity, and using morphological gating to isolate and compare distinct differentiation states.
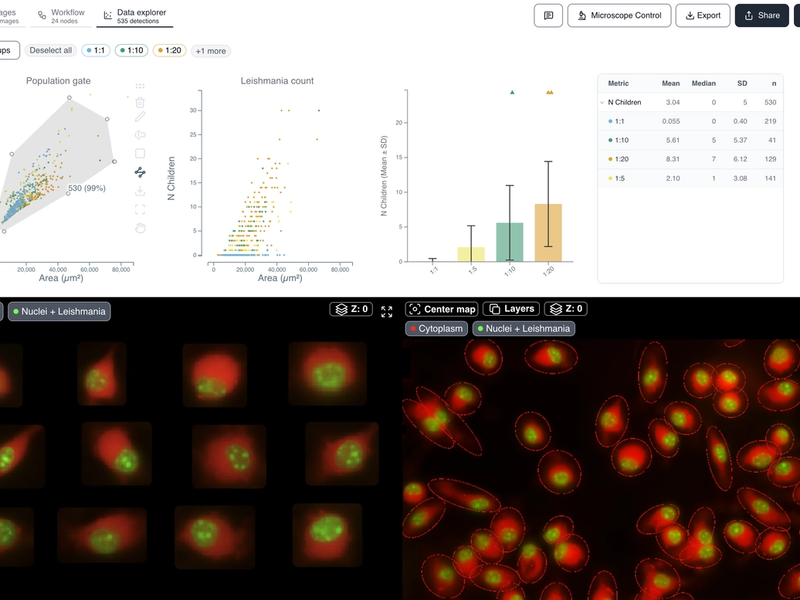
Spot & Foci Detection - Intracellular Sub-Object Counting
A multi-channel high-content image dataset for intracellular spot and foci detection. This example dataset shows how to detect and quantify intracellular sub-objects at the single-cell level with Cytely, comparing sub-object counts per cell across different experimental conditions.
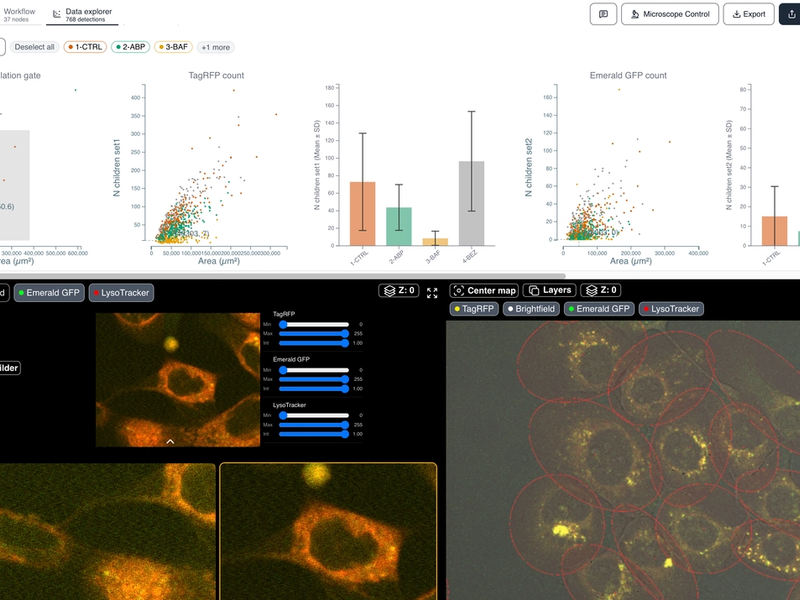
Lysosomal pH Activity in FaDu and HGFb Cells
A 4-channel confocal acquisition of FaDu and HGFb cells treated with autophagy modulators. Autophagosomes carry a tandem TagRFP/Emerald-GFP label (the GFP quenches below pH 6 while TagRFP stays stable) and lysosomes are marked with LysoTracker, giving a ratiometric readout of acidity. Cytely segments lysosomes and reports lysosome count per cell across drug-treatment groups including Bafilomycin and BEZ.
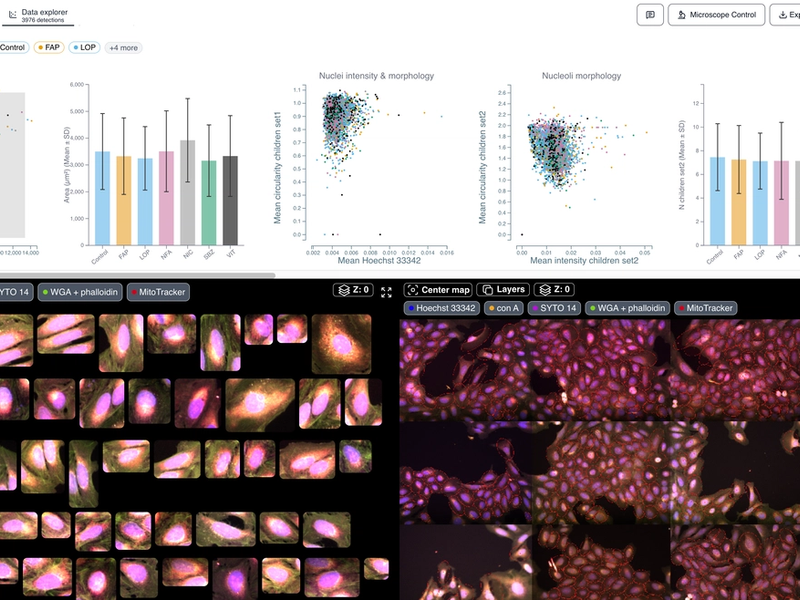
Multiplex Imaging Analysis
A 5-channel Cell Painting acquisition of human U2OS cells from a compound-profiling screen of ~1,600 bioactive compounds. Cytely segments nuclei, cytoplasm, nucleoli, concanavalin-A puncta, and mitochondria, then reports per-cell morphology and object counts across small-molecule treatment groups.
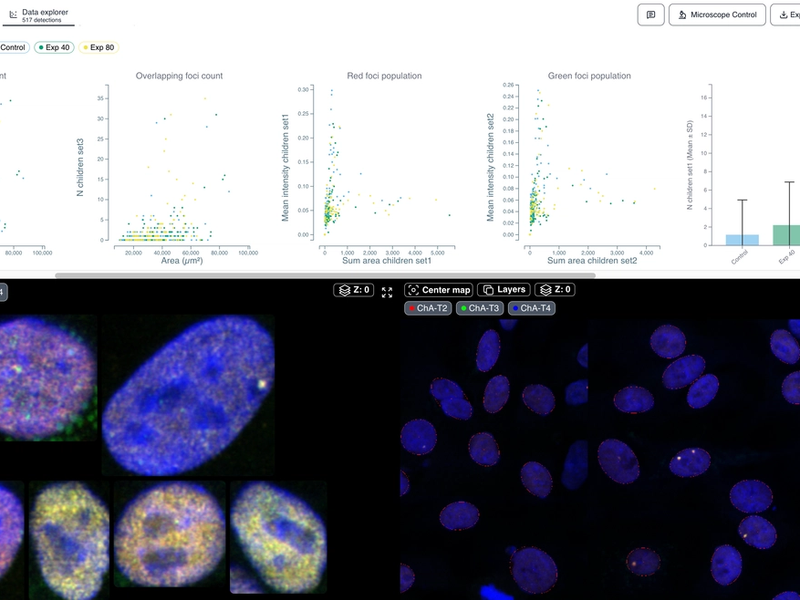
Multi-Marker Foci Association
A multi-channel acquisition for detecting multiple DNA-damage foci markers at the single-cell level. Cytely segments nuclei, detects foci across channels, and reports per-cell foci count, intensity, and area in cells exposed to a DNA-damaging agent.
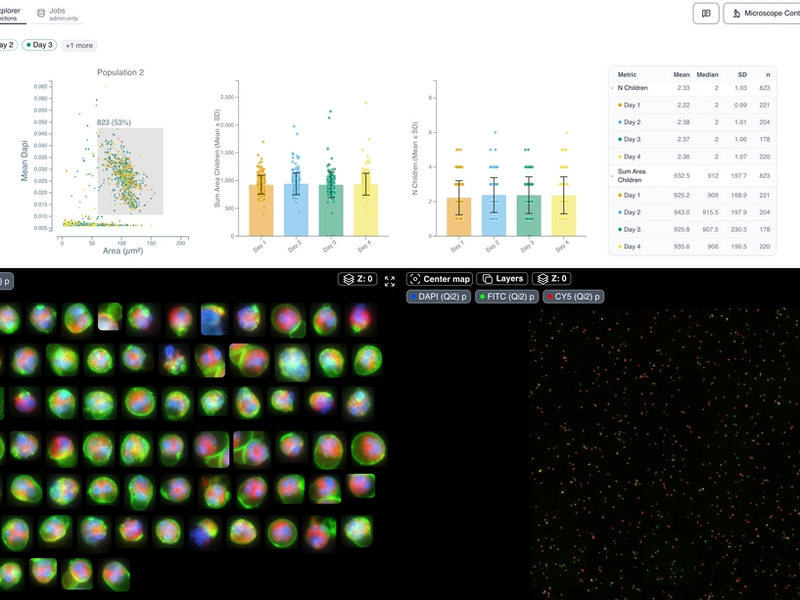
Sub-Object Quantification Example
A 3-channel acquisition (DAPI, FITC, CY5). Cytely segments parent cells and detects smaller objects within them, reporting child count and total child area per parent alongside parent morphology.
Leishmania Infection of Macrophages
A 2-channel acquisition of bone-marrow-derived macrophages infected with Leishmania major. Cytely segments host cells and detects intracellular parasites as sub-objects, reporting the parasite count per host cell. Source: Juez et al., figshare 2023.
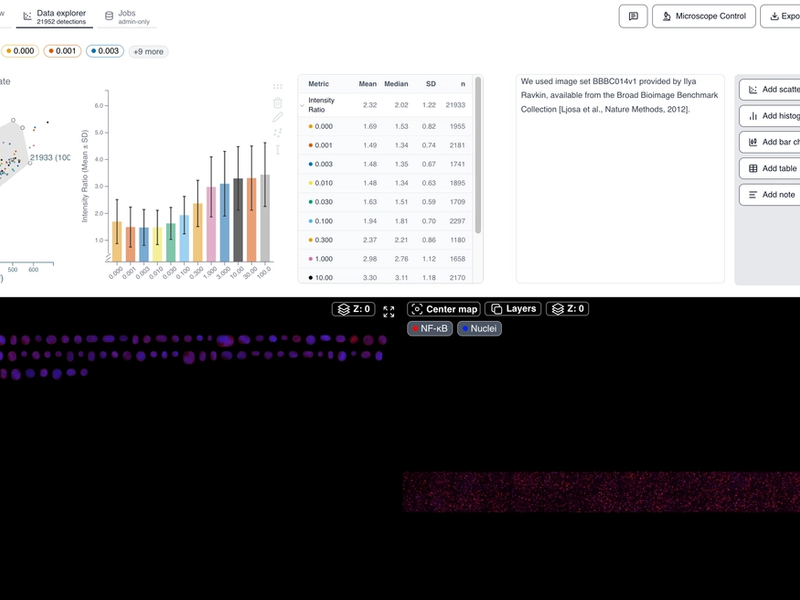
Nuclear Translocation Benchmark (BBBC014v1)
A 2-channel acquisition (DAPI nuclear counterstain + FITC NF-κB signal) from the BBBC014 benchmark: cytoplasm-to-nucleus translocation of the transcription factor NF-κB in MCF7 and A549 cells in response to TNF-α. Cytely segments nuclei and the surrounding cytoplasm and reports the per-cell nuclear/cytoplasmic NF-κB intensity ratio, which rises dose-dependently with TNF-α.
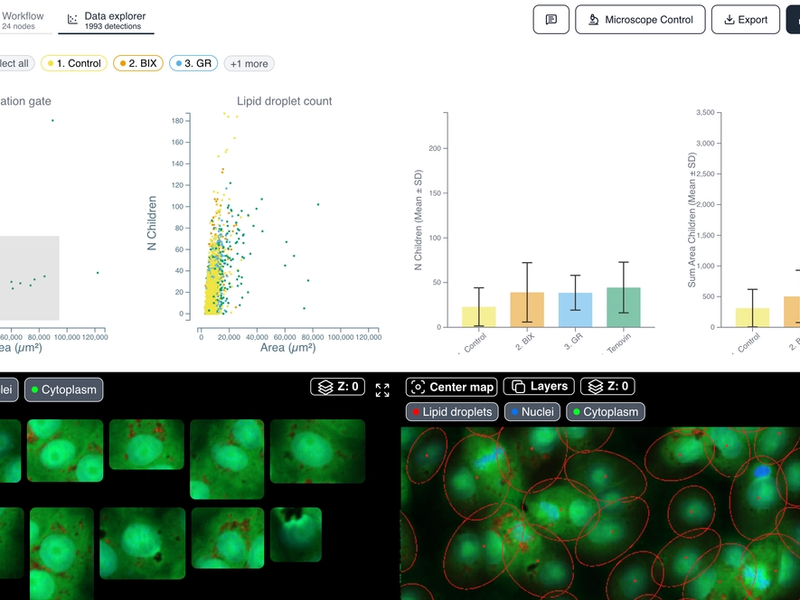
Lipid Droplet Accumulation
A 3-channel acquisition from a phospholipidosis drug-repurposing screen. Cytely segments cells and detects lipid droplets as sub-objects, reporting per-cell droplet count, mean droplet area, and total droplet area. Source: Kuzikov et al., Patterns 2026 (idr0171).
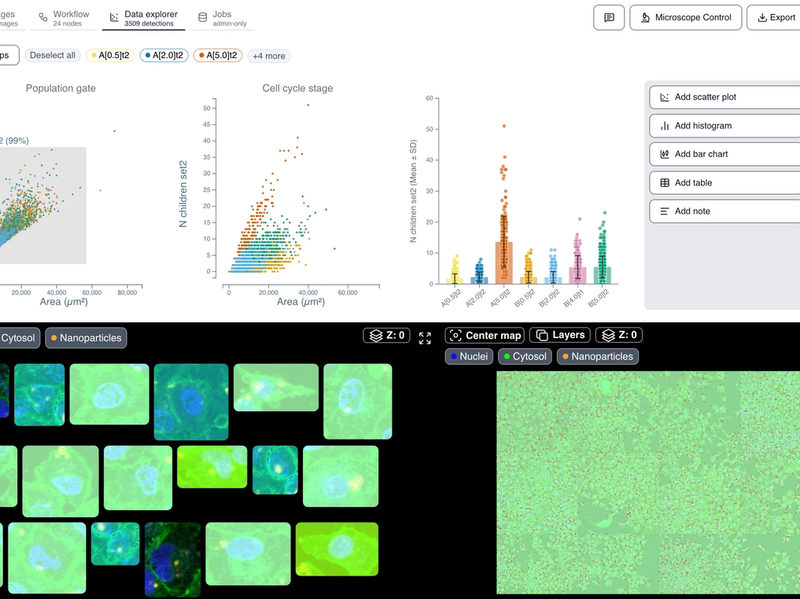
Spot Uptake in Cells
A 3-channel acquisition processed with a dual-sub-object pipeline: cell nuclei segmented as parent objects, spots/peaks detected as children and associated to their host cells. The primary readout is the number of detected children (spots) per cell. Source: Rees et al., Nature Communications 2019 (S-BSST249).
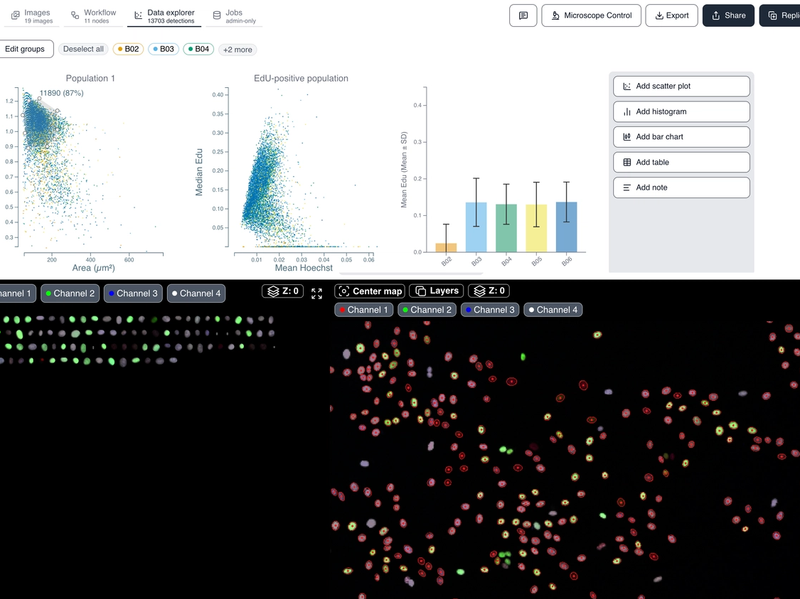
Cell Cycle Arrest in Breast Cancer Cells
A 4-channel acquisition (Hoechst, Phospho-Rb, p21, EdU) of breast cancer cells. Cytely segments nuclei from Hoechst and measures per-nucleus intensity across all four channels, producing a per-cell readout for the EdU-positive (S-phase) population. Source: Weston et al., Sci Data 2024 (S-BIAD1013).
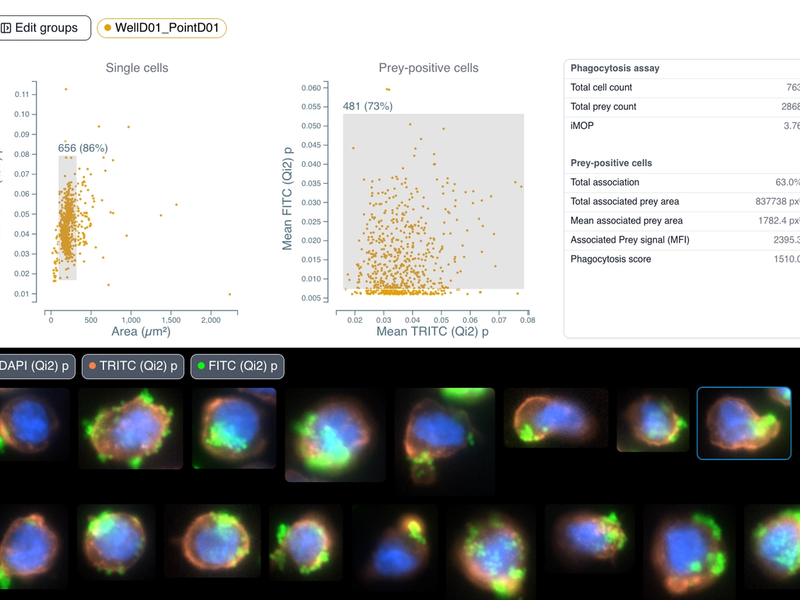
THP-1 Phagocytosis Assay
THP-1 cells stained with wheat germ agglutinin (orange) and DAPI (blue) that have phagocytosed fluorescent beads (green) opsonized by antibody. This dataset showcases Cytely's phagocytosis assay capabilities for measuring particle uptake by immune cells.
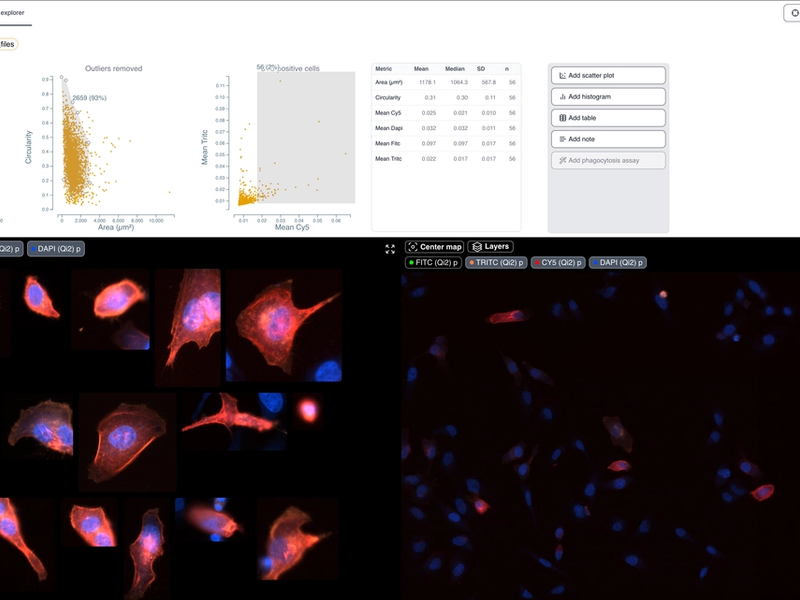
Transfection Efficiency - Actin and Integrin Double Transfection
HeLa cells transfected with integrin (orange/TRITC) and actin (red/Cy5) plasmids, with additional DAPI (blue) nuclear stain and wheat germ agglutinin (green/FITC) membrane stain. This dataset demonstrates how to determine transfection efficiency for both single and double plasmid transfections. Shows relatively low transfection efficiency, highlighting the value of Cytely for method optimization.
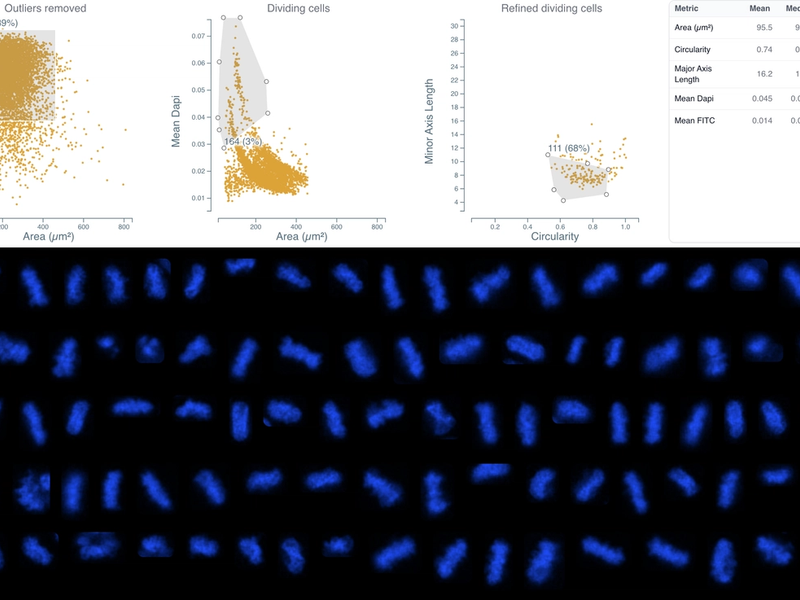
Cell Cycle Analysis - Mitotic Cells in HeLa Cultures
Classification of cell cycle stages in HeLa cells using morphology-based analysis with only standard nuclear staining. This dataset demonstrates identification of cell cycle phases (G0/G1, S/G2, M) using nuclear morphology without specialized dyes. Successfully isolated 164 mitotic cells (3%) from ~5,500 total cells through sequential gating based on nuclear characteristics.
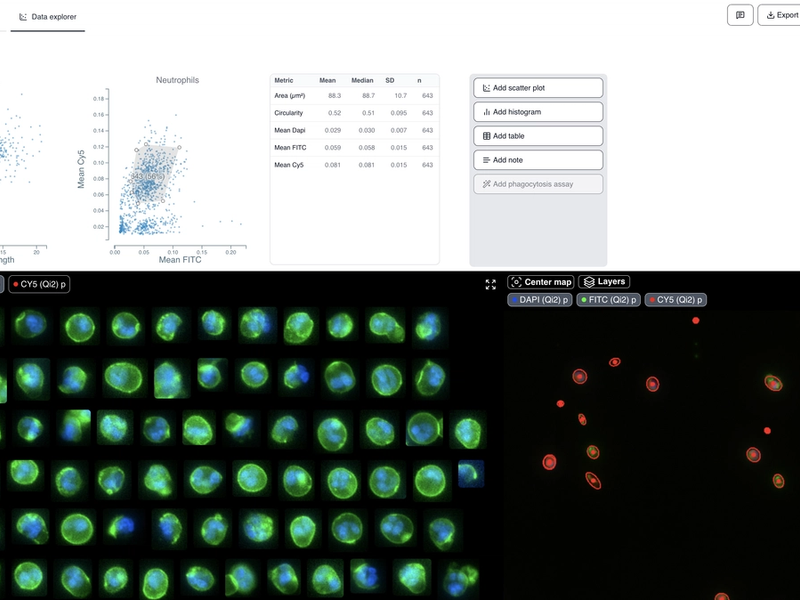
Blood Cell Analysis - Neutrophils
Analyzing cell populations in whole blood samples containing mixed populations of leukocytes, platelets, and red blood cells (RBCs). This dataset demonstrates rapid identification and quantification of different blood cell types at the single-cell level through scatter plots and intuitive gating. Successfully identifies neutrophils (57%), platelets (11%), and RBCs (12%) from a heterogeneous sample.
Ready to analyze your own data?
Book a call with our team to see how Cytely turns your microscopy into standardized, reproducible results.