DNA Damage & Genotoxicity - Foci Counting per Nucleus
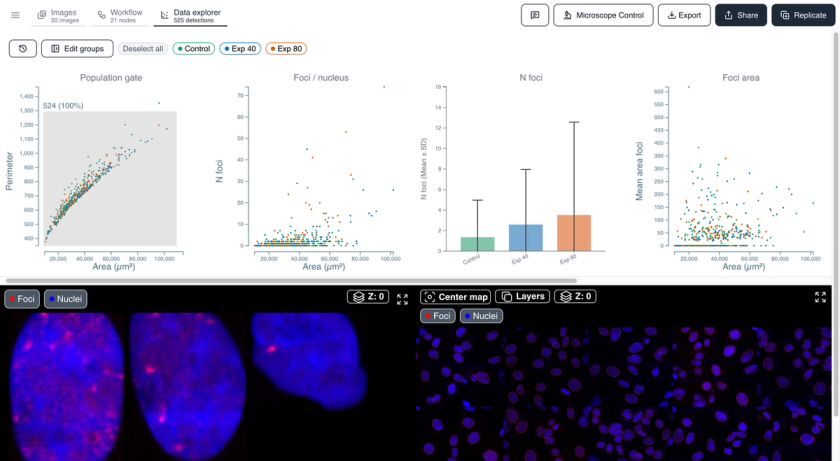
Cells exposed to two concentrations of a DNA-damaging agent and stained for nuclei and DNA damage foci. This example dataset shows how to count damage foci per nucleus, exclude aggregates by gating on nuclear shape, and compare mean foci counts between treatment groups. The foci count per nucleus rises with the concentration of the damaging agent.
See it in action
Watch how this dataset was analyzed end to end in Cytely.
Methodology
Two-channel fluorescence images of nuclei and DNA damage foci from cells treated with two concentrations of a DNA-damaging agent. Nuclei are segmented with Segment Cell Nuclei and cleaned with Fill Holes. Foci are enhanced with an FFT high-pass filter and segmented with Overlapping Background Segmentation; a peak seeder followed by flood fill separates adjacent foci that share a label. Associate Objects and Join Sub Objects assign foci to their parent nucleus and count them. In the results, a nuclear area versus perimeter plot is used to gate out aggregates, a dot plot shows foci per nucleus, and a bar chart compares the mean foci count per cell group.
Attribution
Images provided by Aris Polyzos at Lawrence Berkeley National Laboratory.
This dataset is covered by our Data Preservation Policy.

Ready to analyze your own data?
Book a call with our team to see how Cytely turns your microscopy into standardized, reproducible results.