Tissue Cellularity Quantification - Nuclei Counting in Tissue Sections
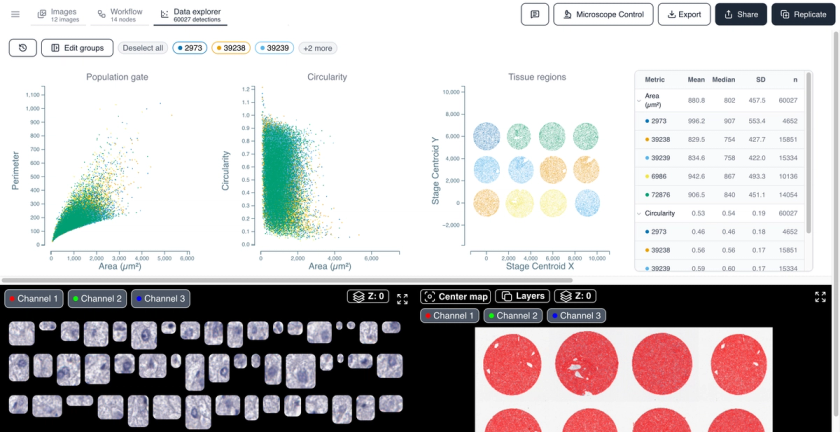
Hematoxylin-stained human tissue sections from the Human Protein Atlas. This example dataset shows how to count nuclei and cells across whole tissue sections and report cellularity per region. Every detected object keeps its position in the section, so regions of interest can be gated directly on the tissue map and compared for area, perimeter, and circularity.
See it in action
Watch how this dataset was analyzed end to end in Cytely.
Methodology
Brightfield images of hematoxylin-stained tissue sections from the Human Protein Atlas. A segmentation mask is first created for the entire tissue section. Nuclei are segmented with Overlapping Background Segmentation, and a watershed step separates touching nuclei that were assigned the same label. The nuclei are then used as seeds to segment the surrounding cytoplasm for whole-cell counts. Results are inspected on a per-slide dot plot: zooming into a slide and drawing a gate isolates a tissue region, and the gate propagates to the downstream plots and the overview map. Area, perimeter, and circularity are plotted per object.
Attribution
Images from the Human Protein Atlas (proteinatlas.org), available under CC BY 4.0. Uhlén M et al., "Tissue-based map of the human proteome." Science 347(6220):1260419, 2015. https://doi.org/10.1126/science.1260419
This dataset is covered by our Data Preservation Policy.

Ready to analyze your own data?
Book a call with our team to see how Cytely turns your microscopy into standardized, reproducible results.