In microscopy, the transition from qualitative observation to quantitative data is a significant challenge. Manual analysis is susceptible to user bias and is impractical for large datasets, while many automated solutions can obscure the connection between the quantitative data and the original visual context. Cytely is a web-based tool designed to address these challenges by integrating automated image segmentation with interactive data exploration. It provides a structured workflow for deriving quantitative metrics from cell populations and linking those metrics back to their source images in real-time.
To facilitate this transition from raw images to actionable data, Cytely is built around a set of core functionalities. Each is designed to systematically process, analyze, and visualize cellular information, ensuring that quantitative results remain directly tied to their visual origins.
Core Functionalities of the Platform:
Automated Object Segmentation and Measurement: The software first performs automated detection and segmentation of objects, typically nuclei, within an image. For each identified object, it calculates a suite of morphological and intensity-based parameters, including Area, Circularity, Major/Minor Axis Length, and Mean Fluorescence Intensity per channel. This process generates a comprehensive dataset representing the entire cell population.
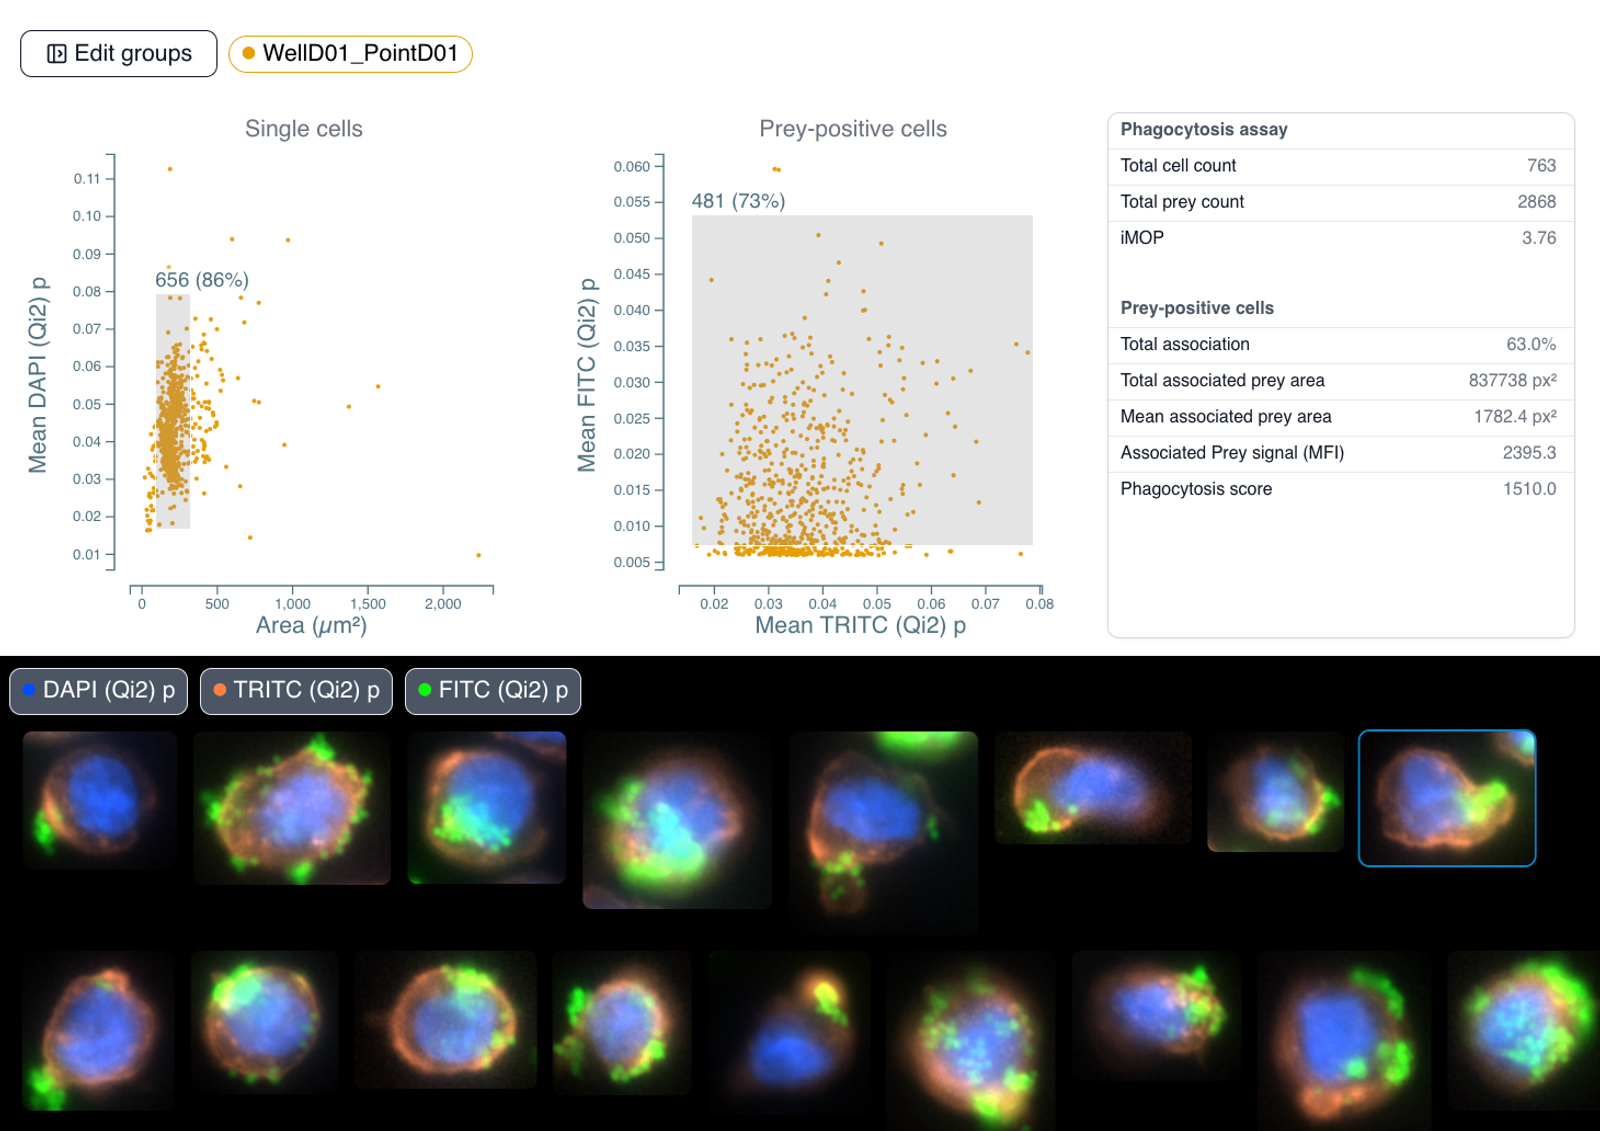
Interactive Data Visualization and Gating: The quantitative data is presented in interactive scatter plots. Users can plot any measured parameter against another to visualize population distributions. On these plots, regions of interest, or "gates," can be drawn to isolate specific subpopulations. This allows for objective filtering of debris, aggregates, or the selection of cells based on specific phenotypic criteria (e.g., high fluorescence, specific size).
Direct Image-to-Data Linkage: A key feature of the workflow is the persistent link between the data points in the scatter plots and the cells in the original image. Selecting a gated population on a plot immediately highlights the corresponding cells on the source image and displays them as individual cropped thumbnails. This visual feedback loop is critical for verifying gating strategies and confirming the morphology of analyzed subpopulations.
This approach facilitates a more objective and reproducible method for tasks like cell counting, quality control, and identifying phenotypically distinct cell populations within a complex sample.