Quantify Phagocytosis with Unparalleled Ease and Accuracy

Overcome the challenges of phagocytosis analysis. Cytely's automated, data-driven platform delivers robust quantification, dynamic insights, and targeted high-resolution imaging for your immunology and cell biology research.

The Challenge of Measuring Phagocytosis

Phagocytosis is a fundamental cellular process crucial for immune defense, tissue homeostasis, development, and diseases like cancer. The process involves several steps: recognition of the target particle via receptors (e.g., Fc receptors, complement receptors, scavenger receptors), signaling to activate the internalization machinery, formation of a phagosome through actin-driven protrusions, and finally maturation into a phagolysosome for degradation.

Despite its importance, quantifying phagocytosis is notoriously challenging with traditional methods. Manual counts are time-consuming, subjective, and suffer from poor reproducibility. Flow cytometry, while offering high throughput, can yield artifacts, struggles to differentiate between bound and internalized particles, and rarely provides kinetic information. Many methods provide only static snapshots, missing the dynamic nature of the process. Distinguishing between association (binding) and actual internalization is often difficult. Furthermore, analysis software like ImageJ or CellProfiler often requires significant expertise and time to configure and validate robust analysis pipelines, further complicating reproducible quantification.

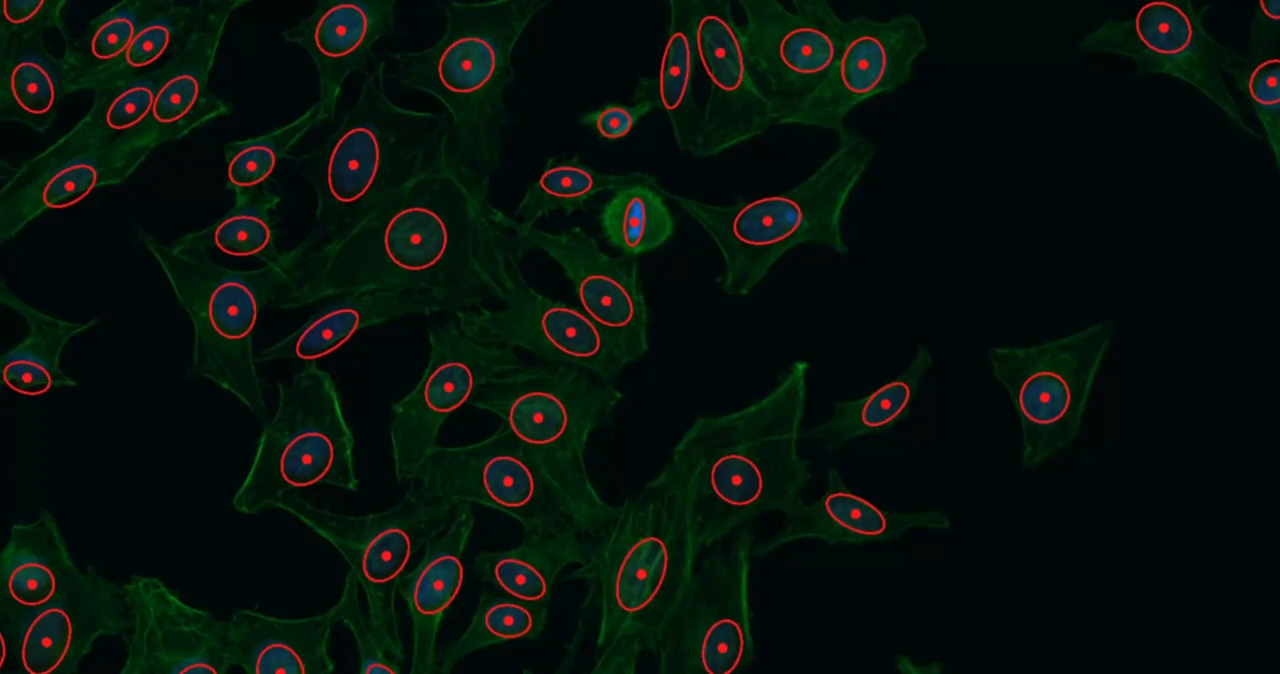
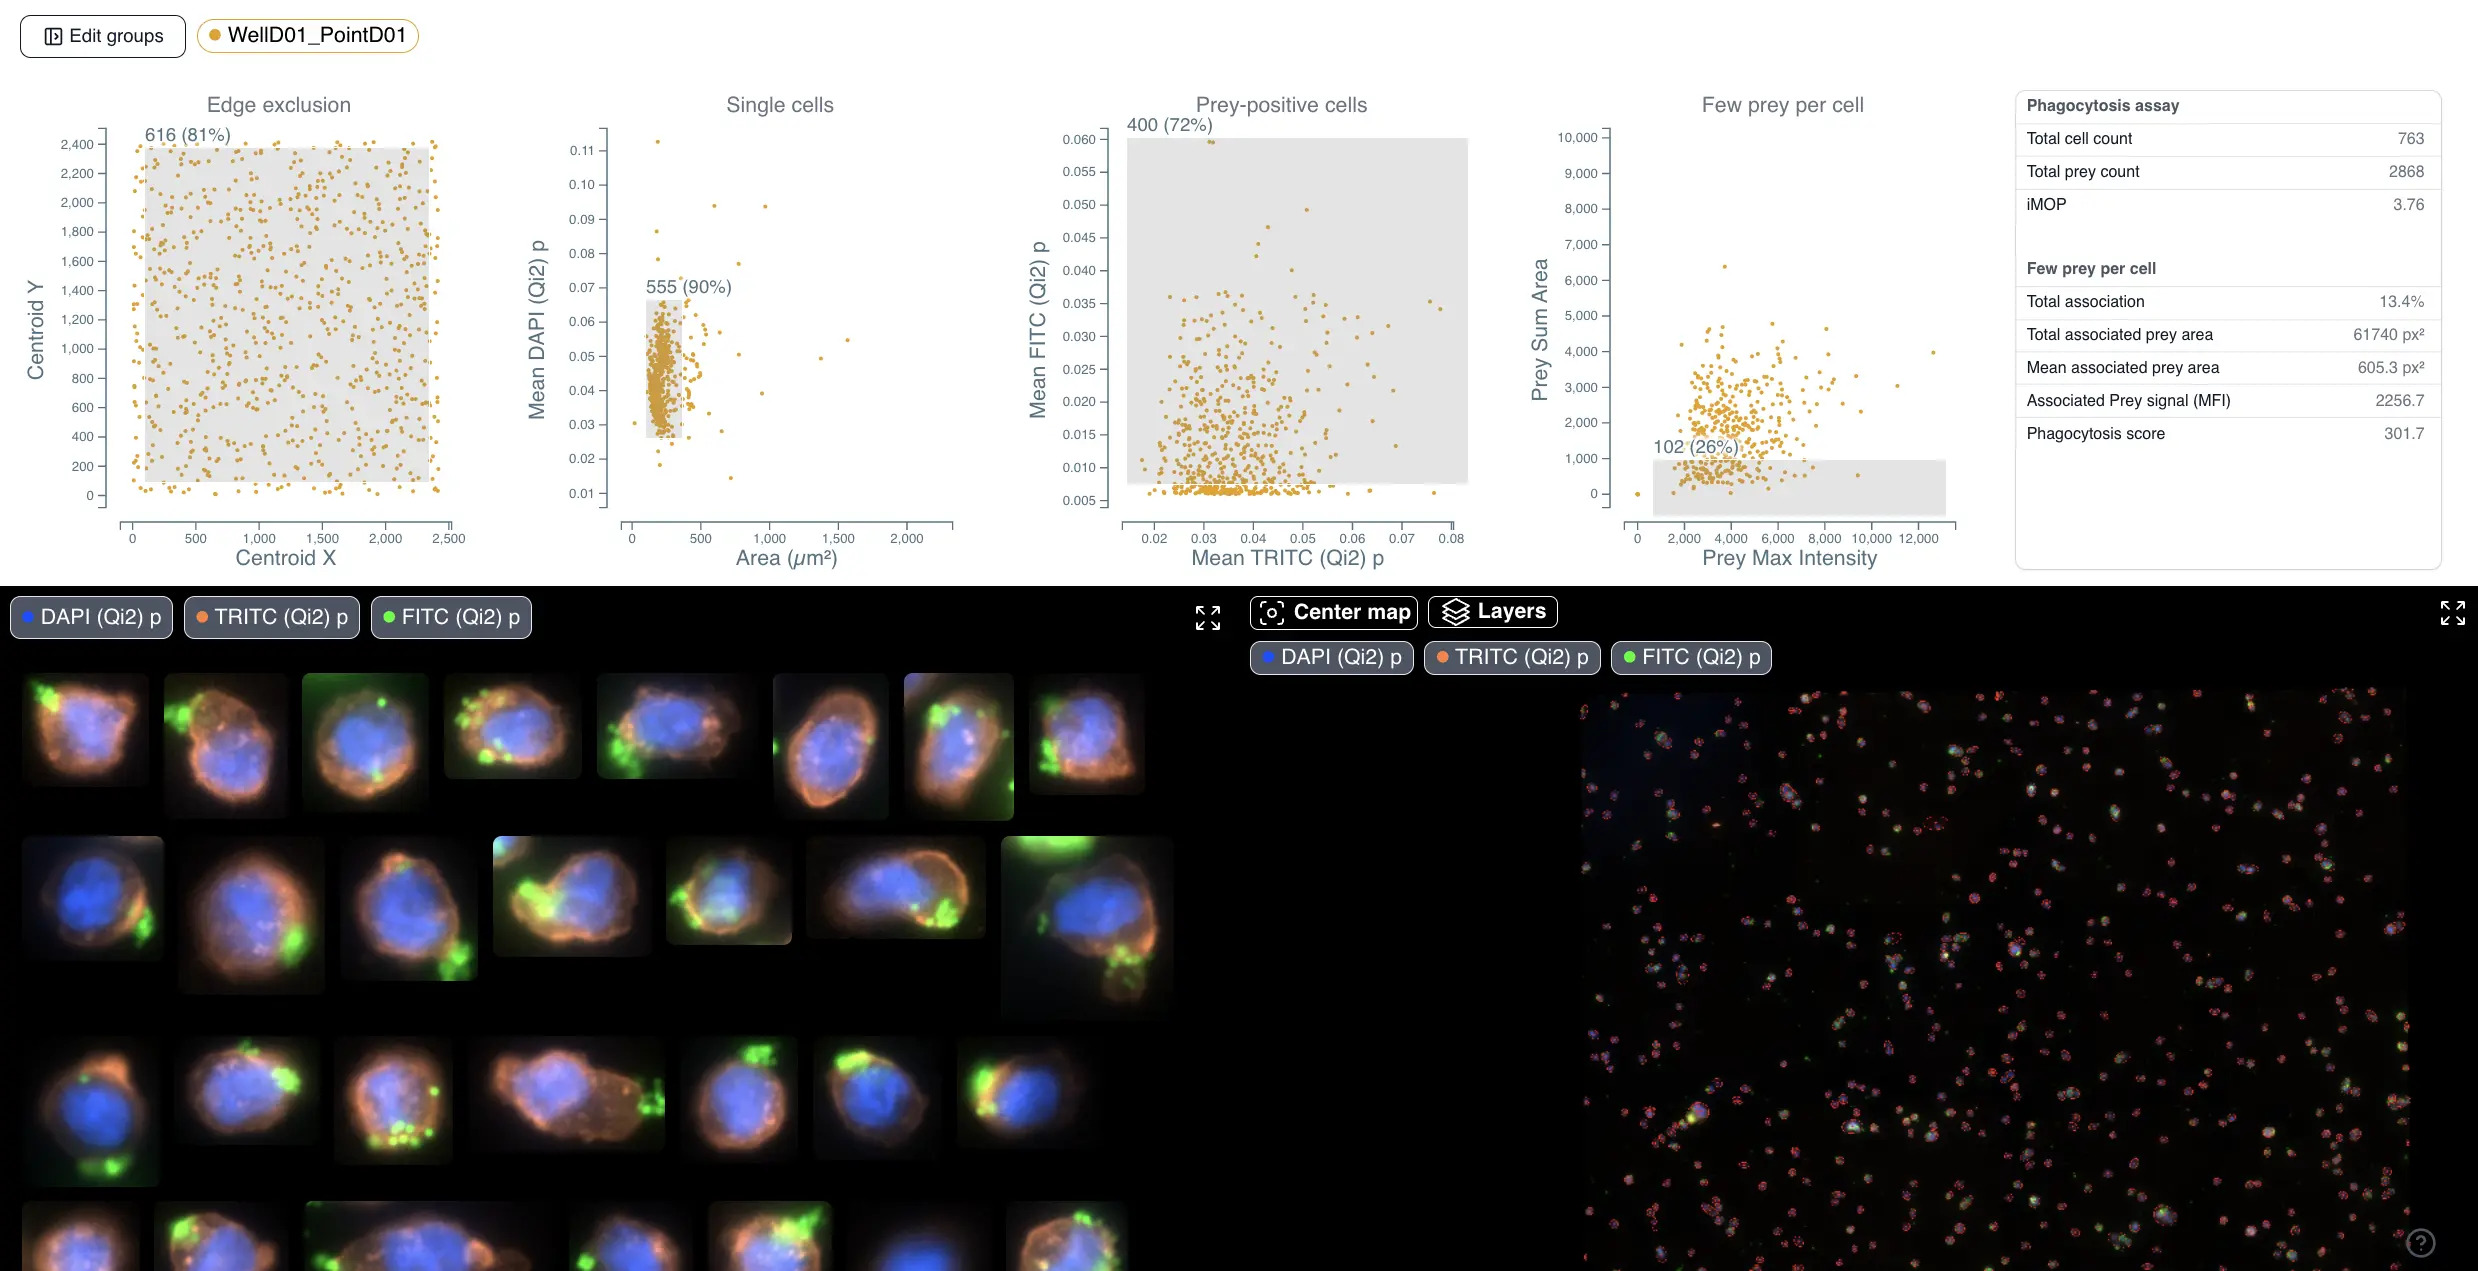
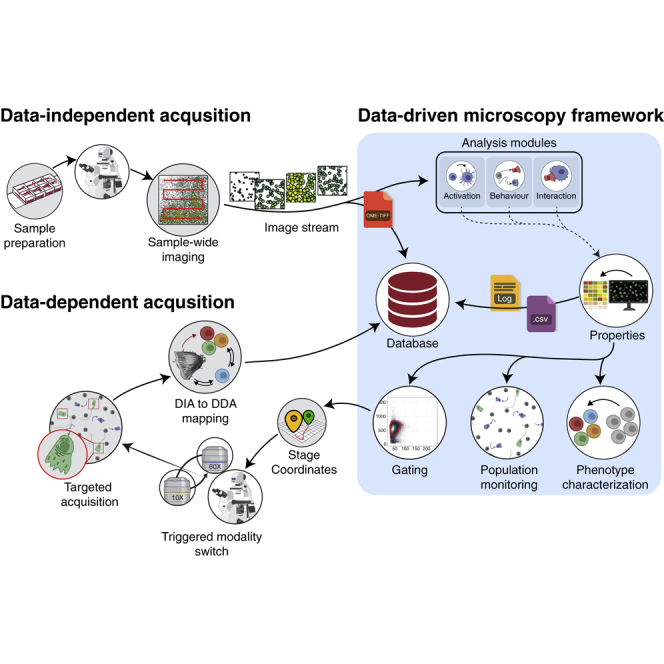
Cytely addresses these challenges by implementing a fully automated workflow based on Data-Driven Microscopy (DDM). This approach combines intelligent image acquisition (separating initial scans from targeted follow-up) with sophisticated real-time analysis to deliver robust, quantitative, and dynamic information about phagocytosis with minimal user intervention.

Cytely's Phagocytosis Workflow

The following illustrates the typical workflow for phagocytosis analysis in Cytely:

Animation illustrating the Cytely phagocytosis workflow steps
  1. 1

    Sample Preparation & Loading

    Standard cell culture on appropriate plates or slides. Minimal setup required in the Cytely platform.

  2. 2

    Experiment Start ("Press Play")

    The user initiates the experiment, and Cytely begins the automated workflow.

  3. 3

    Data-Independent Acquisition (DIA)

    The system performs a rapid scan (often at lower resolution) of the sample area. Real-time segmentation using machine learning automatically identifies phagocytes and prey particles. Initial metrics like cell count, prey count, and association are calculated continuously and stored with coordinates.

  4. 4

    Target Identification & DDA Triggering

    Based on the quantitative data and features extracted during DIA, the system (or user via interactive plots) identifies cells or events meeting predefined criteria (e.g., high uptake level, specific morphology, initiated engulfment event).

  5. 5

    Data-Dependent Acquisition (DDA)

    Cytely sends the coordinates of the selected targets back to the microscope, which is then automatically directed to acquire high-fidelity data of only these targets. This can include higher magnification images, time-lapse sequences, confocal Z-stacks, or other imaging modes.

  6. 6

    Data Integration & Visualization

    High-quality DDA data are automatically linked to the population context from the DIA scan. Interactive plots (scatter plots, histograms, kinetics) and image galleries are generated instantly. Users can explore this data using flow cytometry-like gating on scatter plots, with linked views of individual cell images and overview maps.

  7. 7

    Reporting

    One-click export of quantitative data and publication-ready figures.

Key Features & Benefits for Phagocytosis Analysis

Demonstration of seamless cell and prey segmentation in Cytely

Automatic & Accurate Cell/Prey Detection

Cytely employs advanced machine learning to robustly segment phagocytes and prey particles, even in dense cultures or low-contrast images, label-free or with markers...

Interactive data exploration and gating in Cytely for phagocytosis analysis

Interactive Data Exploration & Visualization

Go beyond static plots. Cytely enables image flow cytometry-like exploration. Create scatter plots, gate subpopulations, and instantly view corresponding cell images...

Dynamic time-lapse analysis of phagocytosis kinetics using Cytely DDA

Dynamic Analysis: Kinetics and Time-Lapse via DDA

Cytely enables detailed analysis of phagocytosis dynamics using DDA for targeted time-lapse imaging. Follow changes in uptake and morphology over time for specific cells...

Cytely enhancing a microscope with Data-Dependent Acquisition for targeted imaging

Targeted High-Fidelity Imaging with DDA

DDA is powerful for phagocytosis. Cytely automatically targets specific cells for high-resolution videos, Z-stacks, or time-lapses, providing deep mechanistic insights...

Population context shown with gating and linked visual analysis in Cytely

Population Context and Reproducibility

DDM places detailed DDA results within the whole population context from DIA. Cytely's automated workflow minimizes bias, ensuring high reproducibility...

Key Phagocytosis Metrics Calculated by Cytely

Cytely provides a comprehensive suite of automatically calculated metrics to quantify various aspects of phagocytosis, offering robust and reproducible insights.

MetricDescriptionHow Cytely Calculates ItWhy It's Valuable
Cell CountTotal number of phagocytes in the analyzed area/sample.Automatic counting of segmented phagocytes (ML-based).Basic normalization parameter.
Prey CountTotal number of prey particles in the analyzed area/sample.Automatic counting of segmented prey particles (ML-based).Used to calculate MOP.
Association (%)Percentage of phagocytes associated with at least one prey particle (defined as "persistent association").Identifies overlap/proximity between segmented phagocytes and prey.Simple, measurable parameter usable for normalization and dose-response analysis.
Image Multiplicity of Prey (iMOP)Ratio of total prey particles to total phagocytes.Calculated from automatically counted cells and prey.Describes the relative concentration of prey, a critical experimental parameter.
MOP50The MOP required for 50% of phagocytes to exhibit persistent association.Determined from the dose-response curve of Association vs. MOP.Used to normalize for experimental variations, increasing robustness and sensitivity in comparisons.
Prey per PhagocyteAverage number and distribution of prey particles associated with/internalized by individual phagocytes.Counts the number of segmented prey particles within/near each segmented phagocyte.Provides insight into uptake efficiency and heterogeneity within the phagocyte population.
Phagocytosis ScoreCalculated as (Percent positive cells) × (Median Fluorescence Intensity - MFI) / constant.Combines association data (% positive) with intensity measurement (MFI) from each cell.Robust metric integrating both the fraction of active cells and the amount of uptake per cell, useful for normalization and comparisons.
Internalized Prey AreaTotal area of prey particles located inside phagocytes.Measures the area of segmented prey objects overlapping with phagocyte segmentation.Enables filtering and analysis based on the amount of actually internalized material.

Resources & Further Information

Visual abstract of the Data-Driven Microscopy paper

Scientific Foundation: Data-Driven Microscopy

Cell Rep Methods. 2023 Mar 6;3(3):100419. doi: 10.1016/j.crmeth.2023.100419.

Data-driven microscopy allows for automated context-specific acquisition of high-fidelity image data.

Oscar André, Johannes Kumra Ahnlide, Nils Norlin, Vinay Swaminathan, Pontus Nordenfelt.

Read Full Paper (PMC10088093)